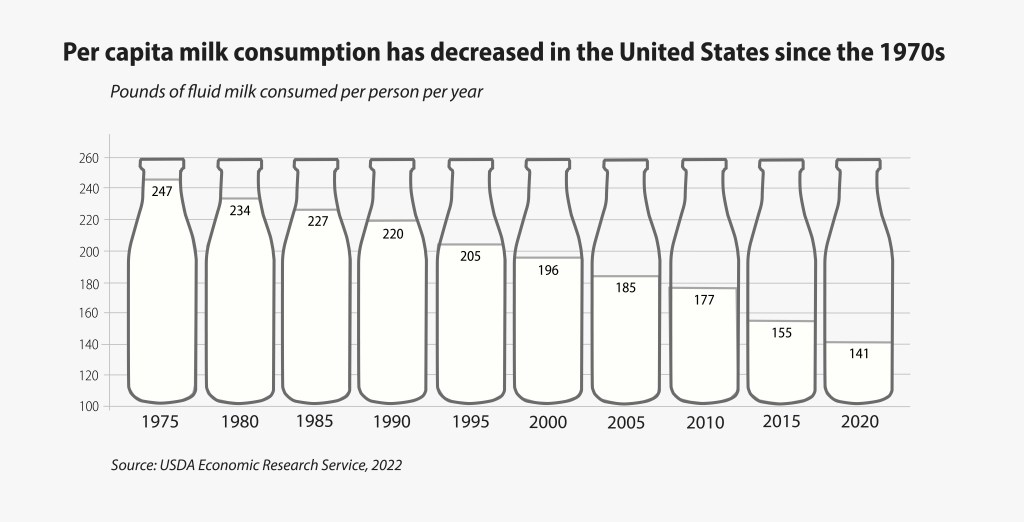
Trends in Fluid Milk Consumption science graphics This bar graph, made fully in Adobe Illustrator, is a visualization of data from the USDA ERS. Related